What I Learned From Doing a Personal Greenhouse Gas Inventory
A couple years ago I took an Environmental Science course on analytical methods for energy and climate — as part of the course, one of our assignments was to complete a greenhouse gas (GHG) inventory for our household over the course of a year.
A GHG inventory is a systematic list of GHG emissions (and removals, if applicable) divided into three scopes: Scope 1 captures direct emissions (e.g., fuel that you, as an individual or organization, personally combusted), Scope 2 captures indirect energy emissions (e.g., using electricity produced by a power plant), and Scope 3 includes all other indirect sources of greenhouse gases (e.g., emissions from air travel, or emissions from the production of food or goods). The MIT Climate Portal has a nice breakdown on the three scopes and more examples of them.
Since then, I’ve gotten in the habit of doing one of these inventories every year, and I find it to be an interesting exercise in both understanding the current energy landscape and estimating the impact of certain counterfactuals (e.g., “what if I used heating oil instead of air-source heat pumps?”). In this post, I’ll share how I do my inventory, and some interesting insights I’ve thought about along the way.
Data and Tools
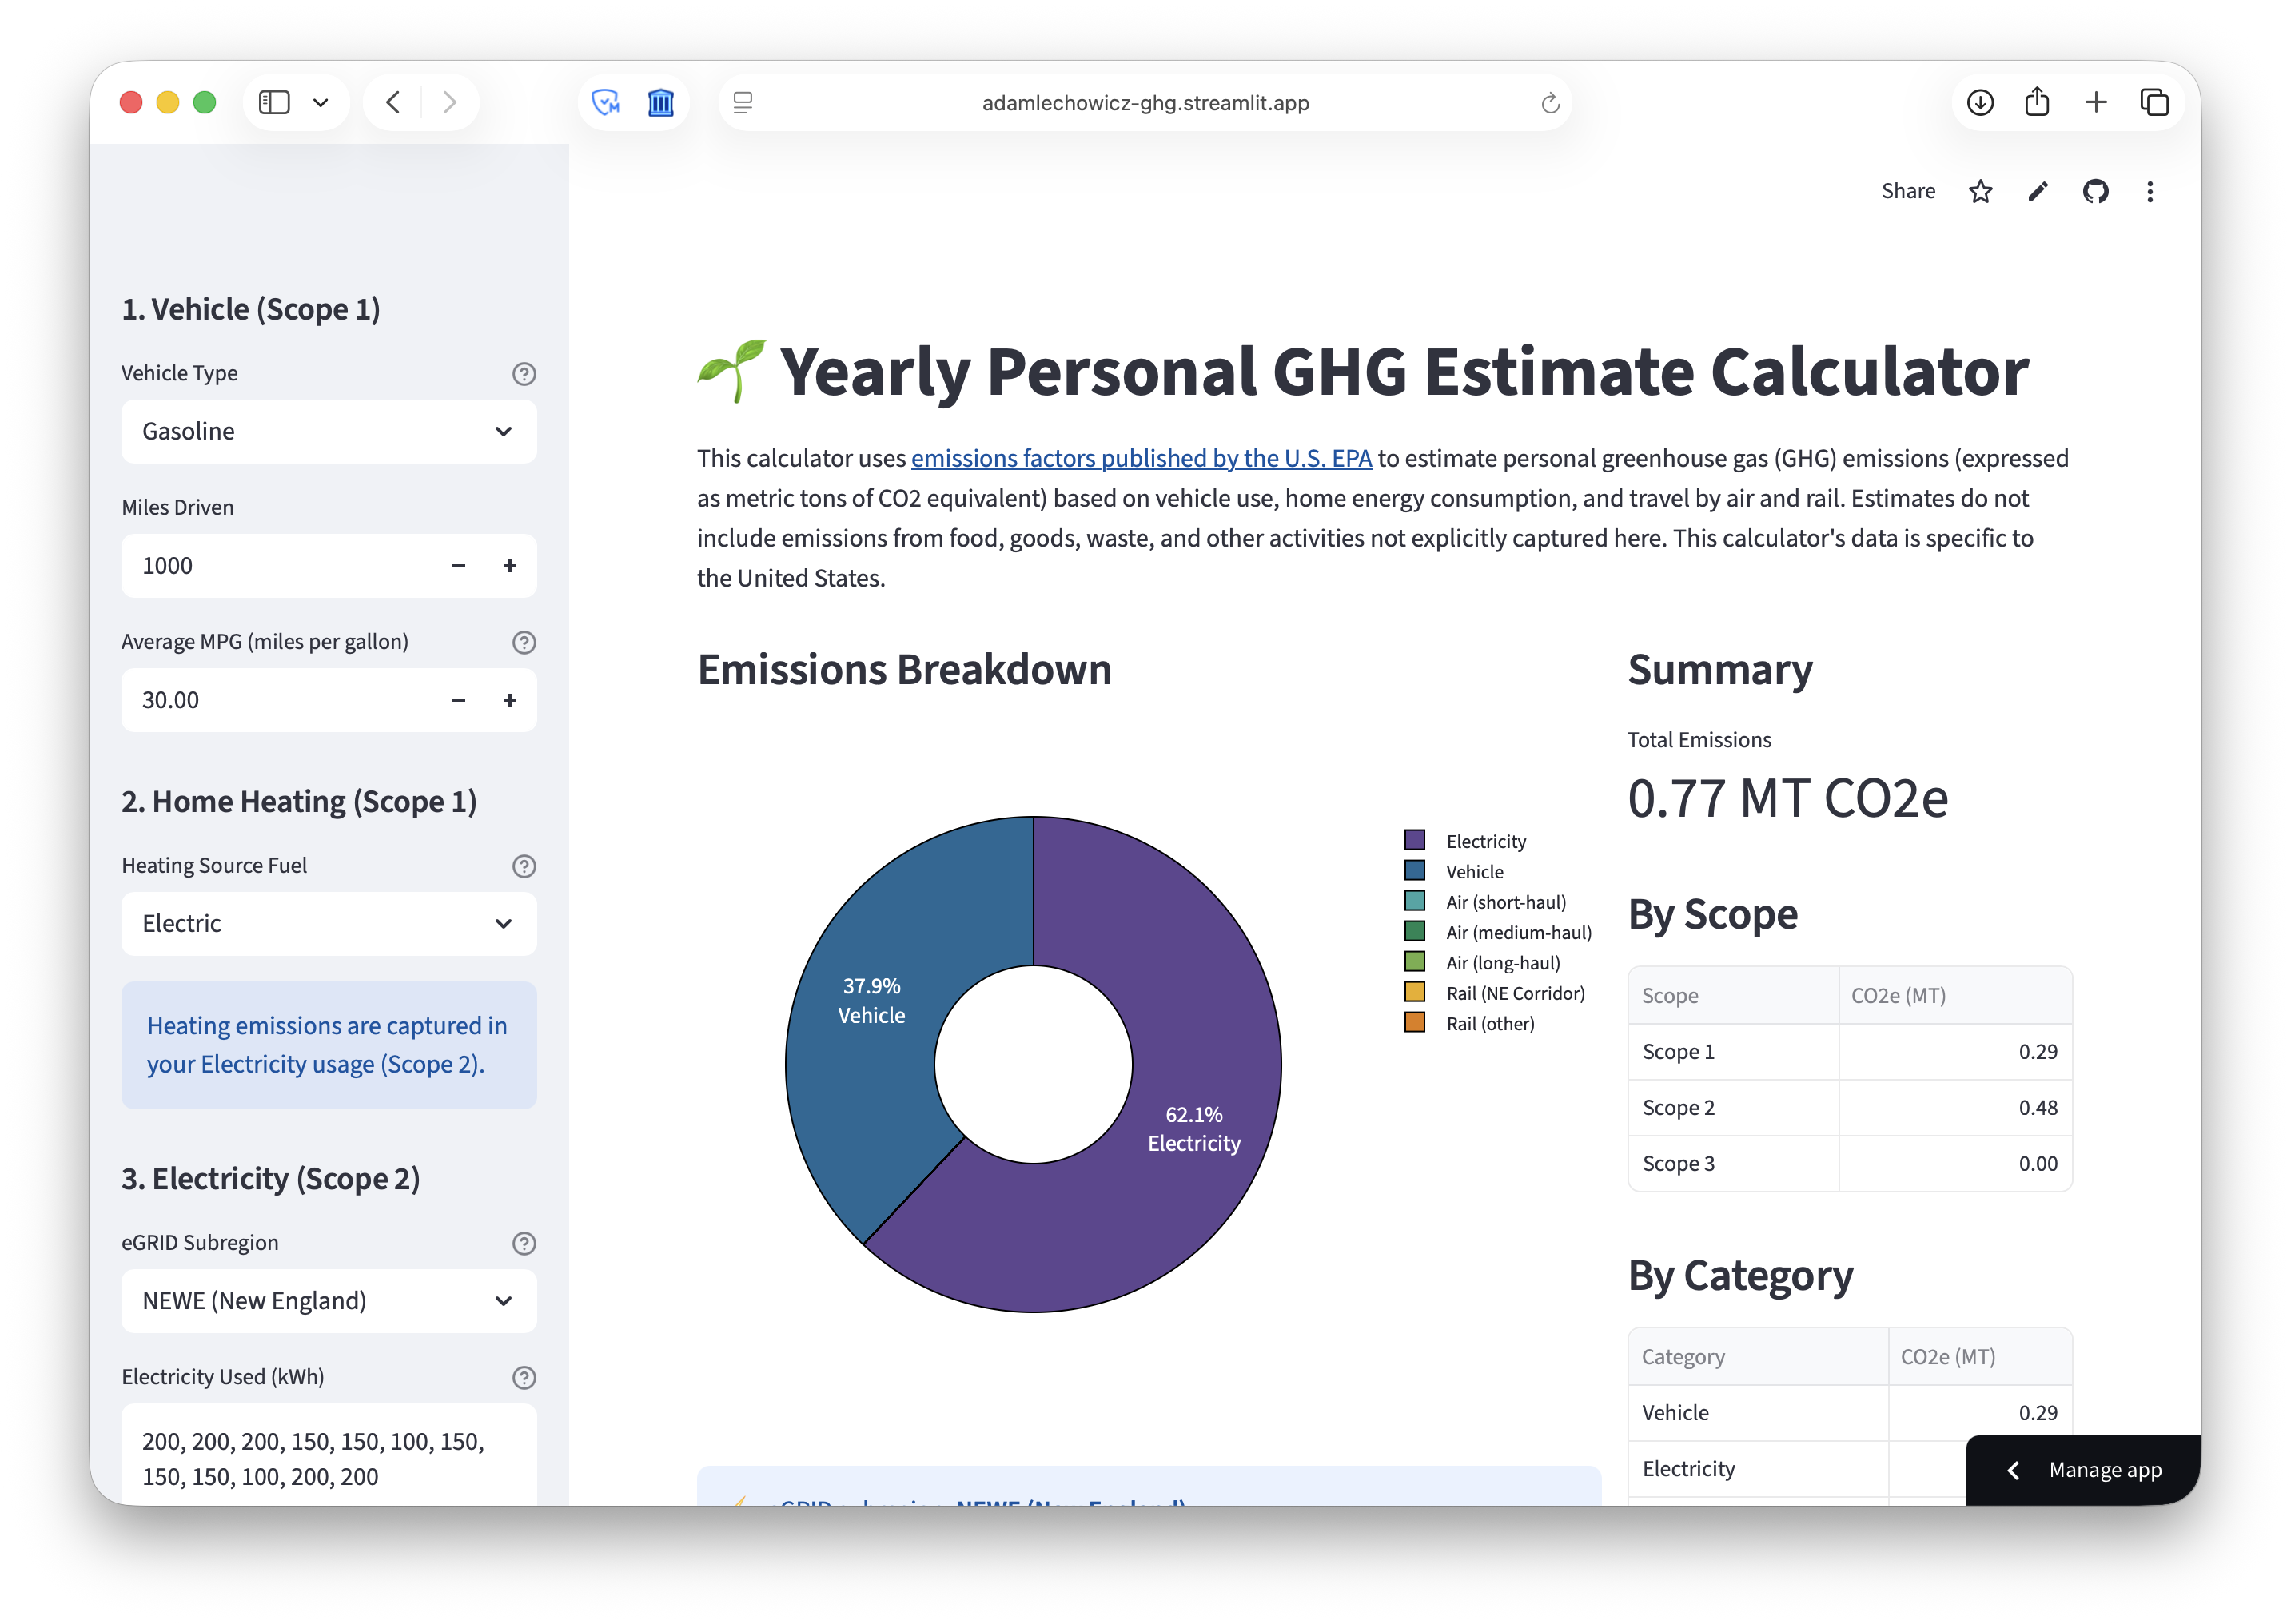
I built a small Streamlit app to ingest data and generate plots for my GHG inventory — it’s publicly available here (note that you might have to “wake” the app if it hasn’t been used today, which can take a few seconds). The calculator uses emissions factors published by the U.S. EPA to compute emissions (in metric tons of CO2 equivalent) from inputs.
For a basic inventory such as mine (i.e., omitting emissions from waste, food, etc.), there are only a few pieces of data needed. I drive a gasoline car, so I need my total mileage and my average fuel economy (in miles per gallon (MPG)) for the year (EV usage can be captured using electricity usage data, assuming mostly home charging is used). Based on where I live, I need to select the correct eGRID subregion (e.g., “NEWE” for New England) to get an estimate of the emissions factor for my home electricity usage, and the total amount of electricity I used at home over the year (in kWh).
Finally, if I use any fossil fuels at home (e.g., for heating), I need to know the total amount of fuel used (e.g., in gallons of heating oil, or therms of natural gas). These inputs are all that’s needed to compute Scope 1 and Scope 2 emissions estimates.
For Scope 3, the EPA also publishes (estimated) emissions factors for air and rail (Amtrak) travel on a per-passenger-mile basis, so I include those in my inventory. In my Streamlit app, I include two input fields that automatically map a given route (e.g., “BOS to LAX”) to a corresponding distance and category (e.g., “rail travel, Northeast Corridor”) to make this logging process a bit easier.
Observations and Counterfactuals
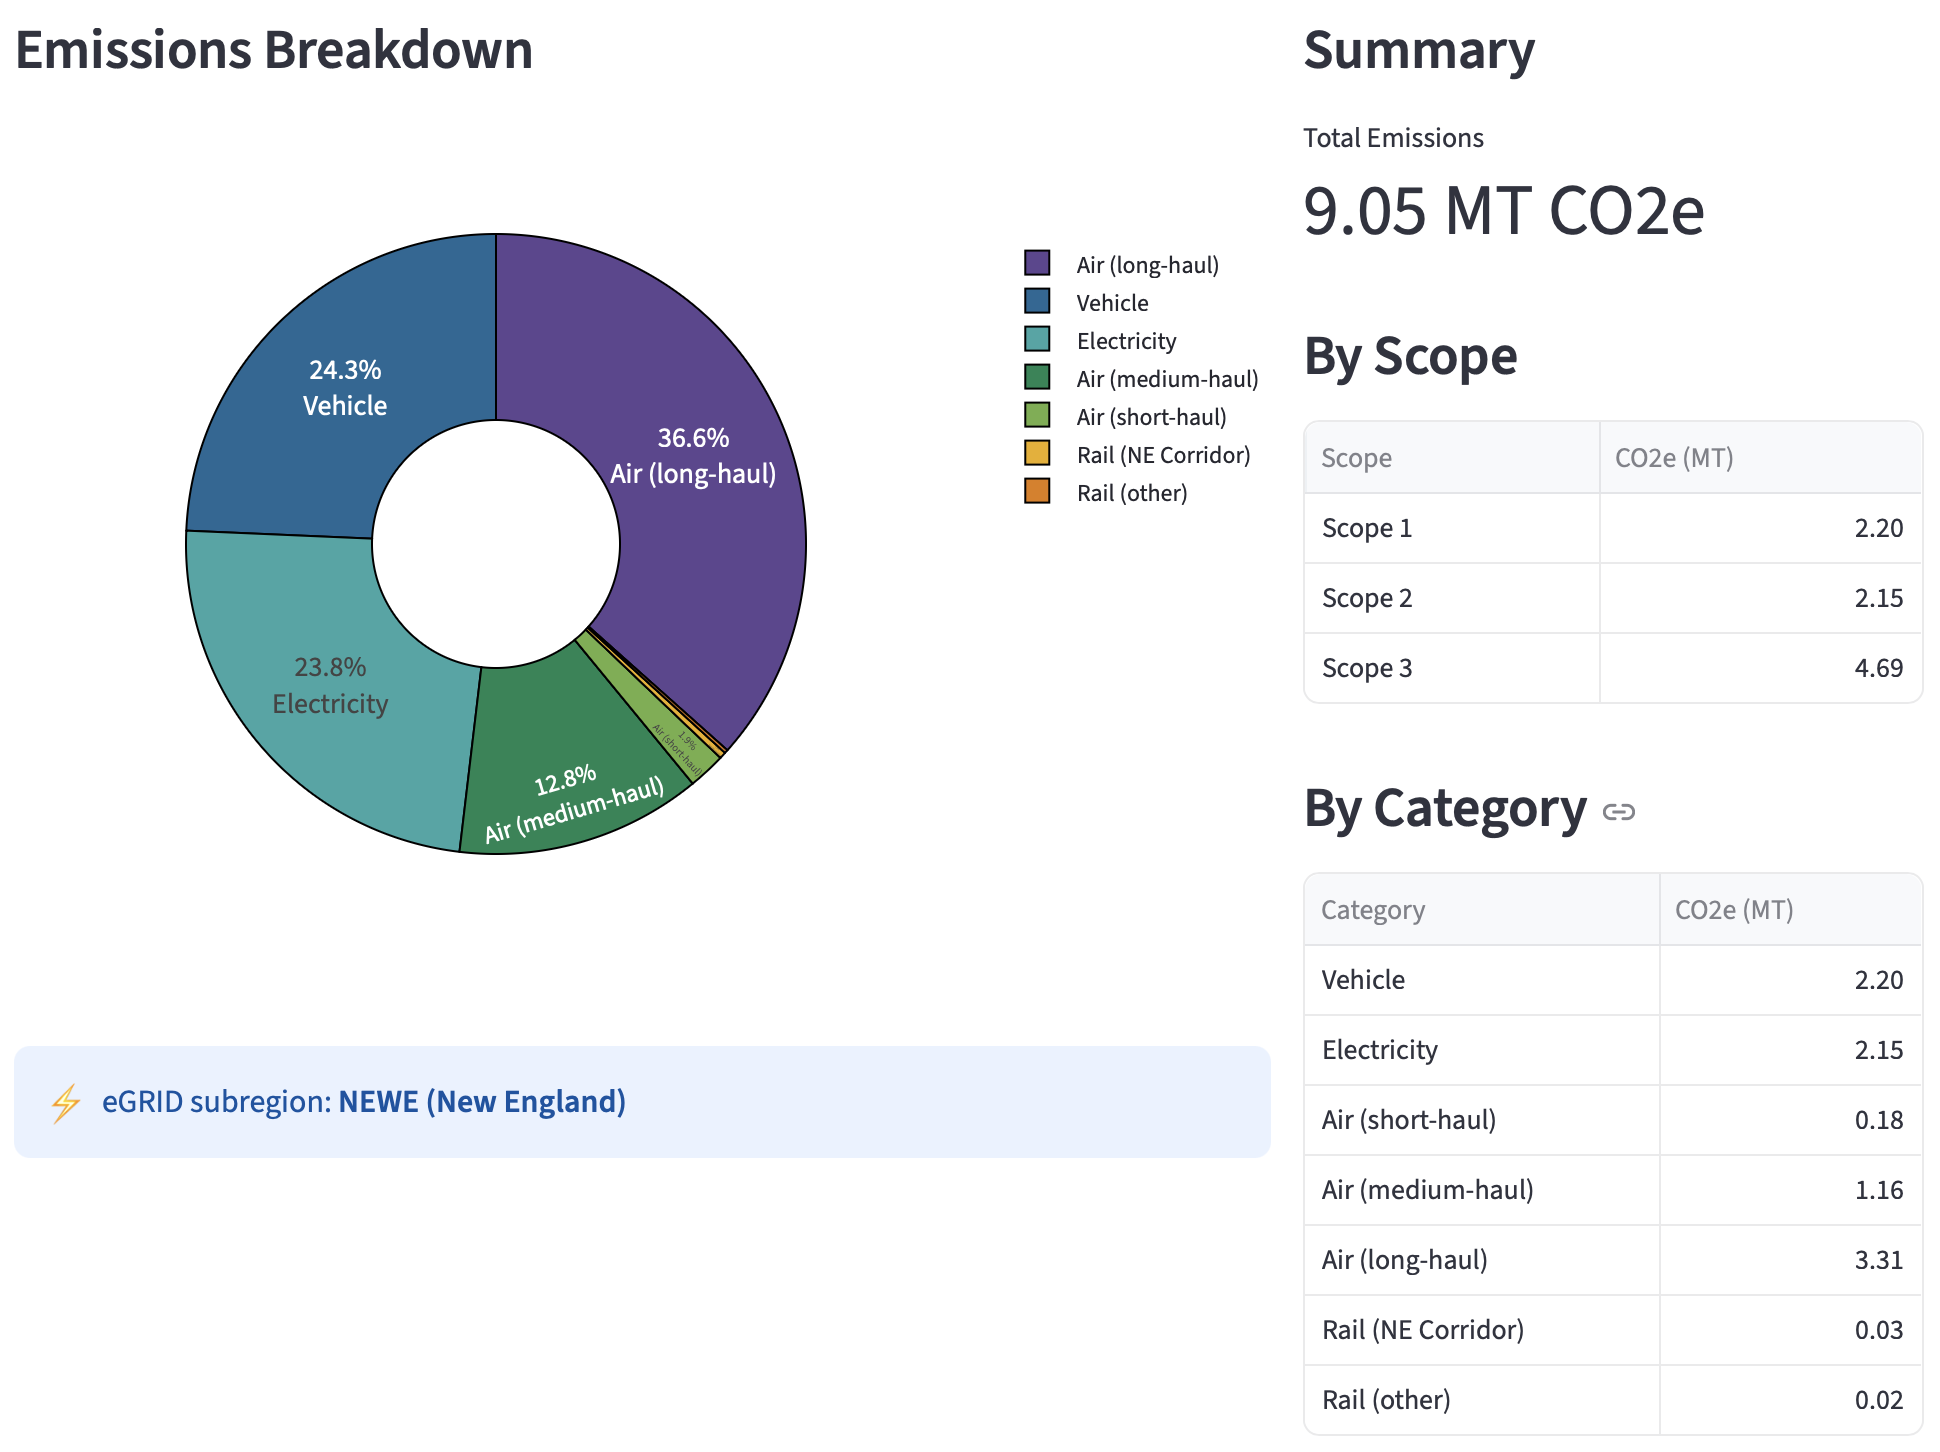
For 2025, my inventory reports that my total emissions were around 9 metric tons of CO2 equivalent (2.2 from Scope 1 vehicle travel, 2.15 from Scope 2 electricity usage, and 4.69 from Scope 3) – see a further breakdown in the pie chart above. We heat and cool our apartment using mini-split air-source heat pumps, so all of those emissions are grouped under Scope 2.
Perhaps the most surprising component of my inventory as-is is that the emissions associated with my air travel exceed those associated with the rest of my year (i.e., Scope 1 and Scope 2, vehicle travel and all energy usage at home). I do travel a lot for both work and leisure, but I was still surprised to see just how much of an outsized impact a few yearly trips can have on my overall emissions.
What if I used heating oil instead?
Our apartment contains both mini-split heat pumps and a “backup” boiler that uses heating oil.1 Since we moved in, we’ve exclusively used the heat pumps for both heating and cooling, but a natural question I can ask using my inventory is “what would happen to my emissions if I used the boiler instead of the heat pumps for heating?”
To estimate the answer to this question, I can “shave off” my electricity usage that is attributable to heating (e.g., by looking at the difference in electricity usage between winter months and milder months) and use that electricity usage to estimate the amount of heating oil I would have used instead. For instance, between Aug-Oct, our average monthly electricity usage was around 430 kWh, implying that any usage above 430 kWh in winter months (e.g., Nov-Apr) is likely attributable to heating. This leaves 3,047 kWh of electricity usage that I’ll consider as “air-source heat pump” usage.
Assuming an average coefficient of performance (COP) of at least 2.5 for our heat pumps (a reasonable estimate for recent cold-climate models), this translates to ~7,618 kWh of heat delivered into our apartment, which would have required at least 185 gallons of heating oil (assuming 41 kWh of heat energy stored per gallon of heating oil2 and 100% boiler efficiency).
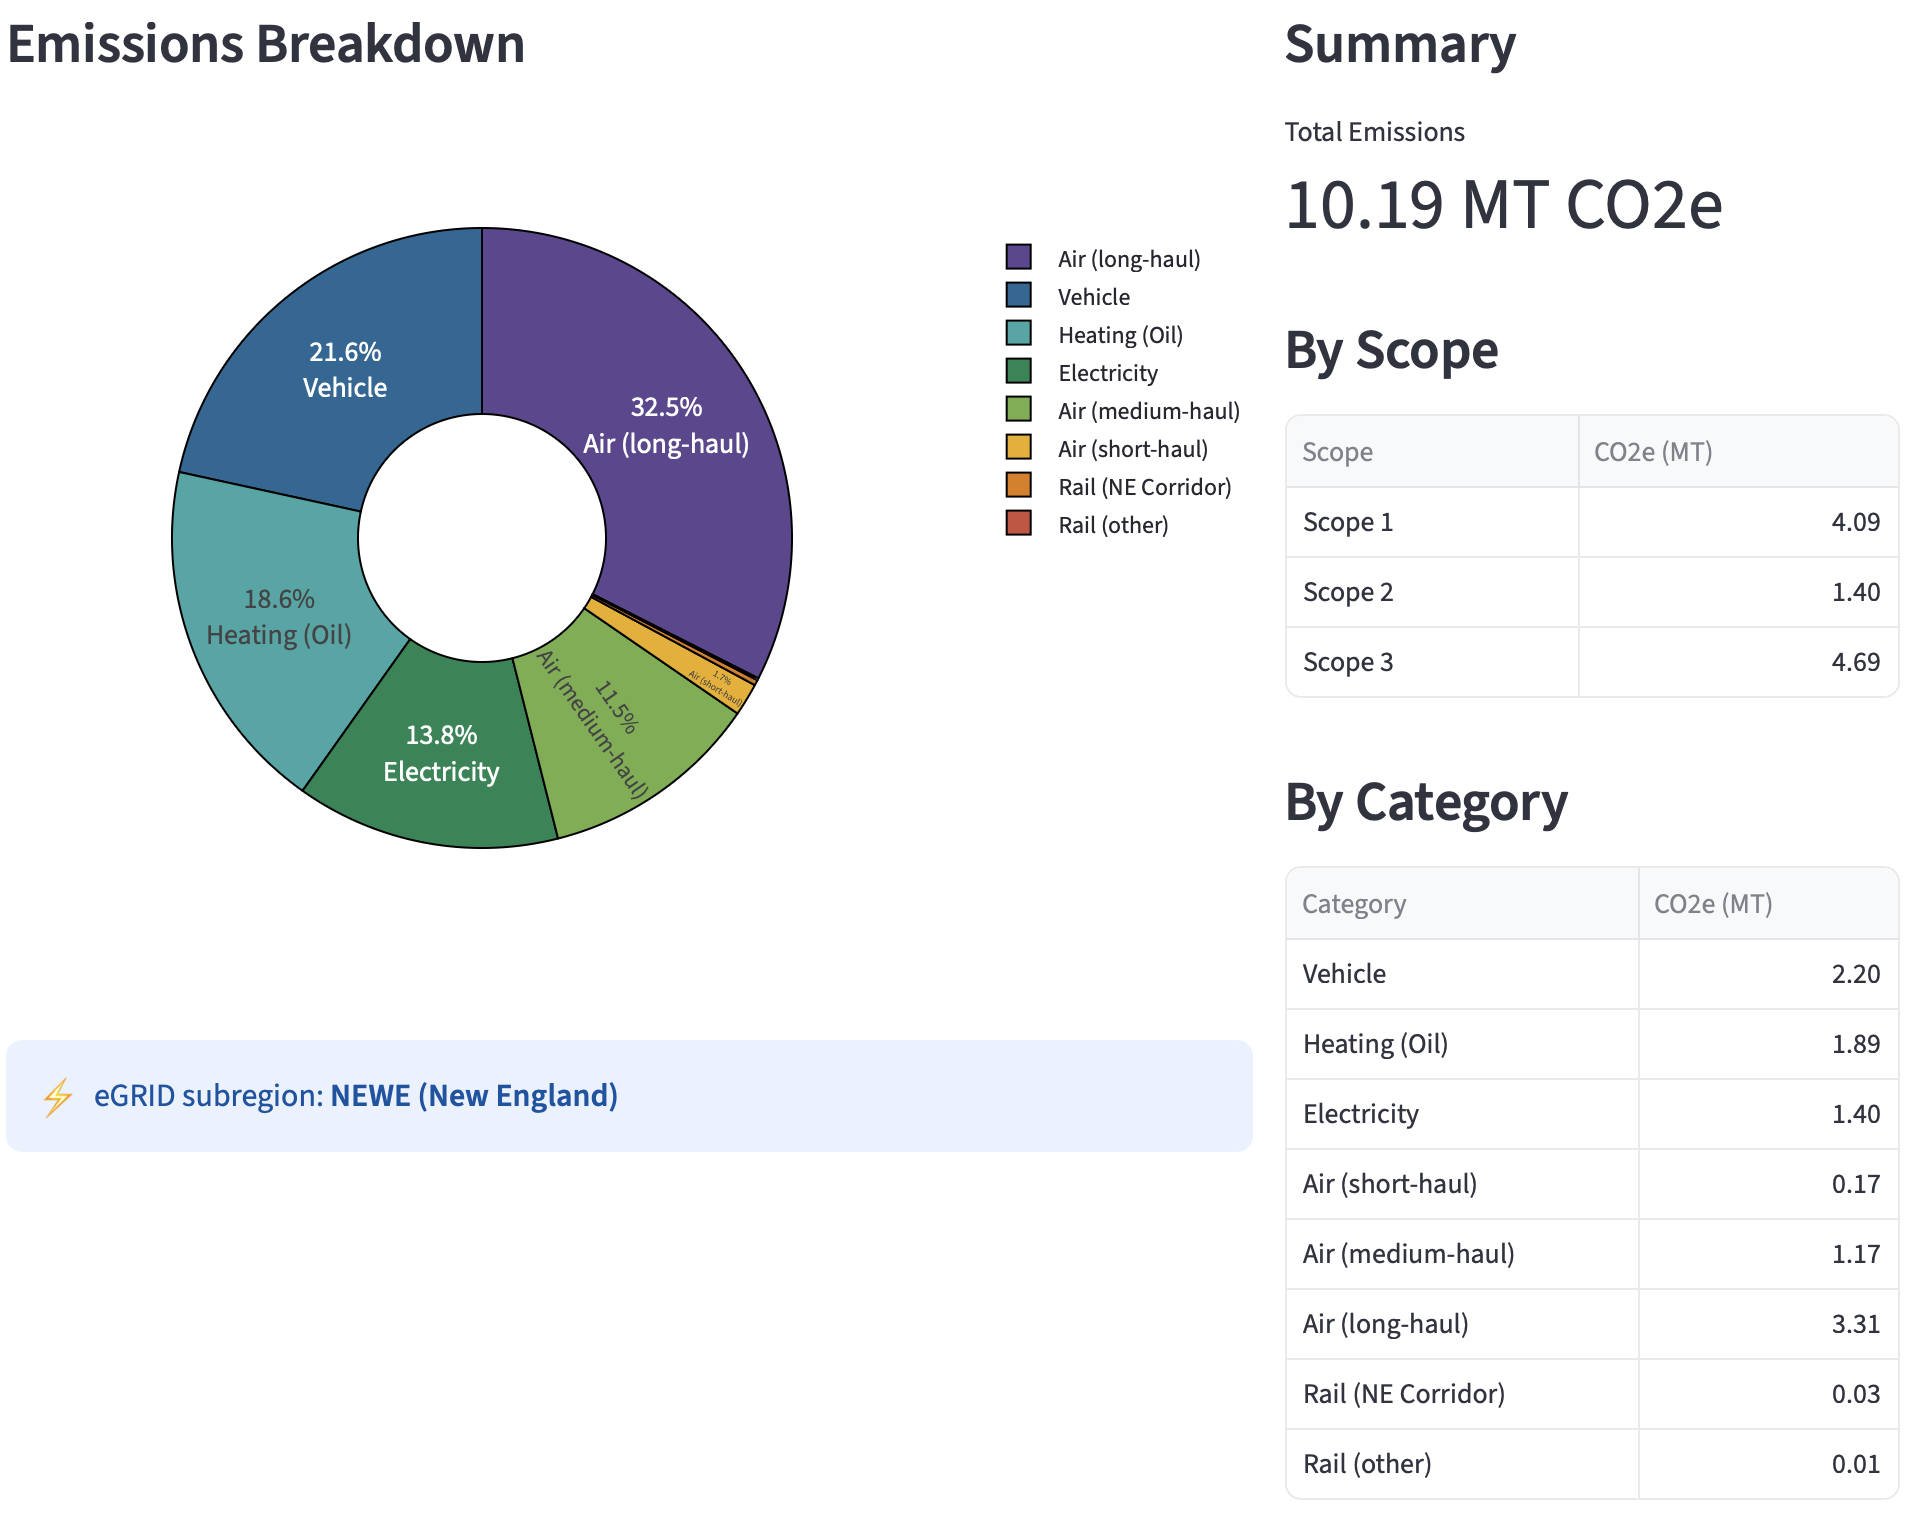
Interestingly, even using electricity from the New England grid (which relies heavily on natural gas), heating our apartment using heating oil would have generated an extra metric ton of GHG emissions over the course of the year compared to using heat pumps. This all boils down to efficiency – even though furnaces/boilers are often >90% efficient in converting fuel to heat, the COP (effective efficiency) of a heat pump means that it can comfortably satisfy our heat needs using much less energy and thus results in fewer emissions.
What if I drove an electric vehicle?
I don’t drive an EV, but I can also use my inventory to estimate the impact of switching to an EV compared to my current gasoline car. To estimate this, I can take my total mileage for the year (around 8,000 miles) and divide it by the average efficiency of small EVs (e.g., around 3.5-4.5 miles per kWh) to get an estimate of the electricity usage that would be required to satisfy my driving needs with an EV.
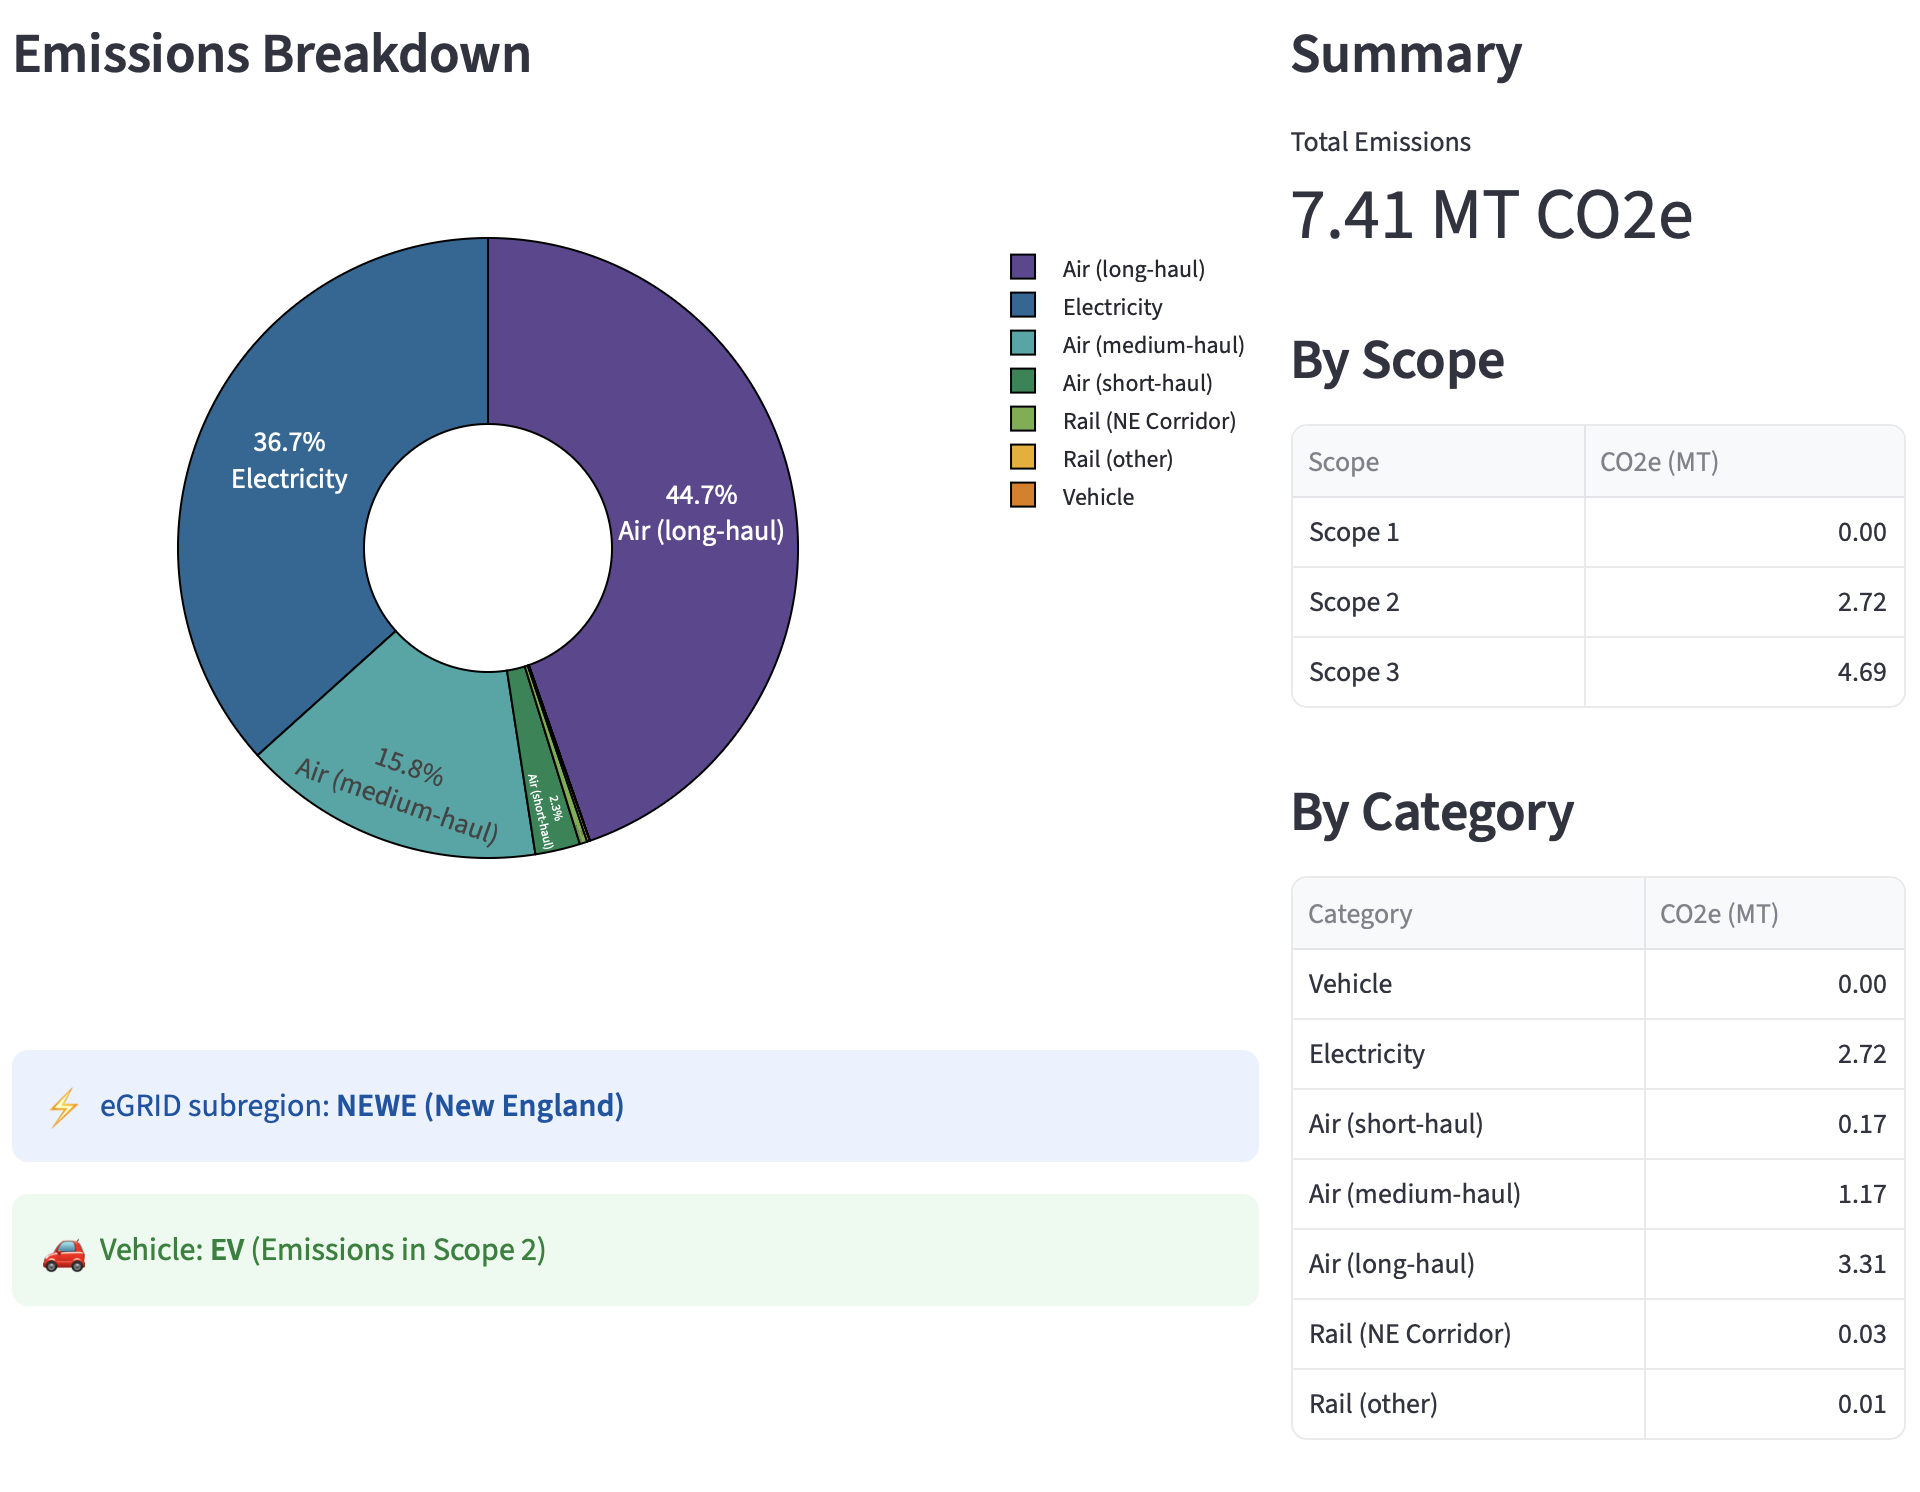
Assuming the low-end efficiency of 3.5 miles per kWh, this translates to an additional 2,283 kWh of electricity usage, and an additional 0.56 metric tons of GHG emissions (using the New England grid emissions factor). This would offset, however, the 2.2 metric tons of GHG emissions associated with my gasoline usage, resulting in a net reduction of around 1.6 metric tons of yearly GHG emissions.
Similar to heat pumps, EVs are much more efficient than their gasoline counterparts (e.g., they can convert 80-90% of stored energy into movement, compared to only about 20–30% of fuel energy that is converted into movement by gasoline cars). This means that even though EVs are powered by electricity that may have a non-trivial emissions factor (e.g., from natural gas power plants), they can still result in significant emissions reductions.
Conclusions and Takeaways
While all of the above results are somewhat anecdotal and specific to my situation, I find it grounding to see the relative scale of different emission sources and understand the impact of certain decisions and technologies – it’s a nice way to connect the dots between “what really matters” in the energy transition.
If you’re interested in doing your own GHG inventory, check out the Streamlit app and use it as a starting point for your own inventory. There’s a .xlsx export option to save a record offline, and the code is open source. Drop me a line if you have any thoughts or improvement suggestions!
-
New England seems to be one of the few regions where “heating oil” is still relatively common for residential heating. I suspect most people do not know that heating oil (or so-called “#2 fuel oil”) is essentially just diesel fuel (typically heating oil is just dyed red to distinguish that it isn’t subject to a road tax). ↩
-
Heating oil has an energy density of 137,500 British thermal units per US gallon. ↩